BF-PLOT - Plotting and Visualization
Ver. 3.4.0 (2025-06-15)
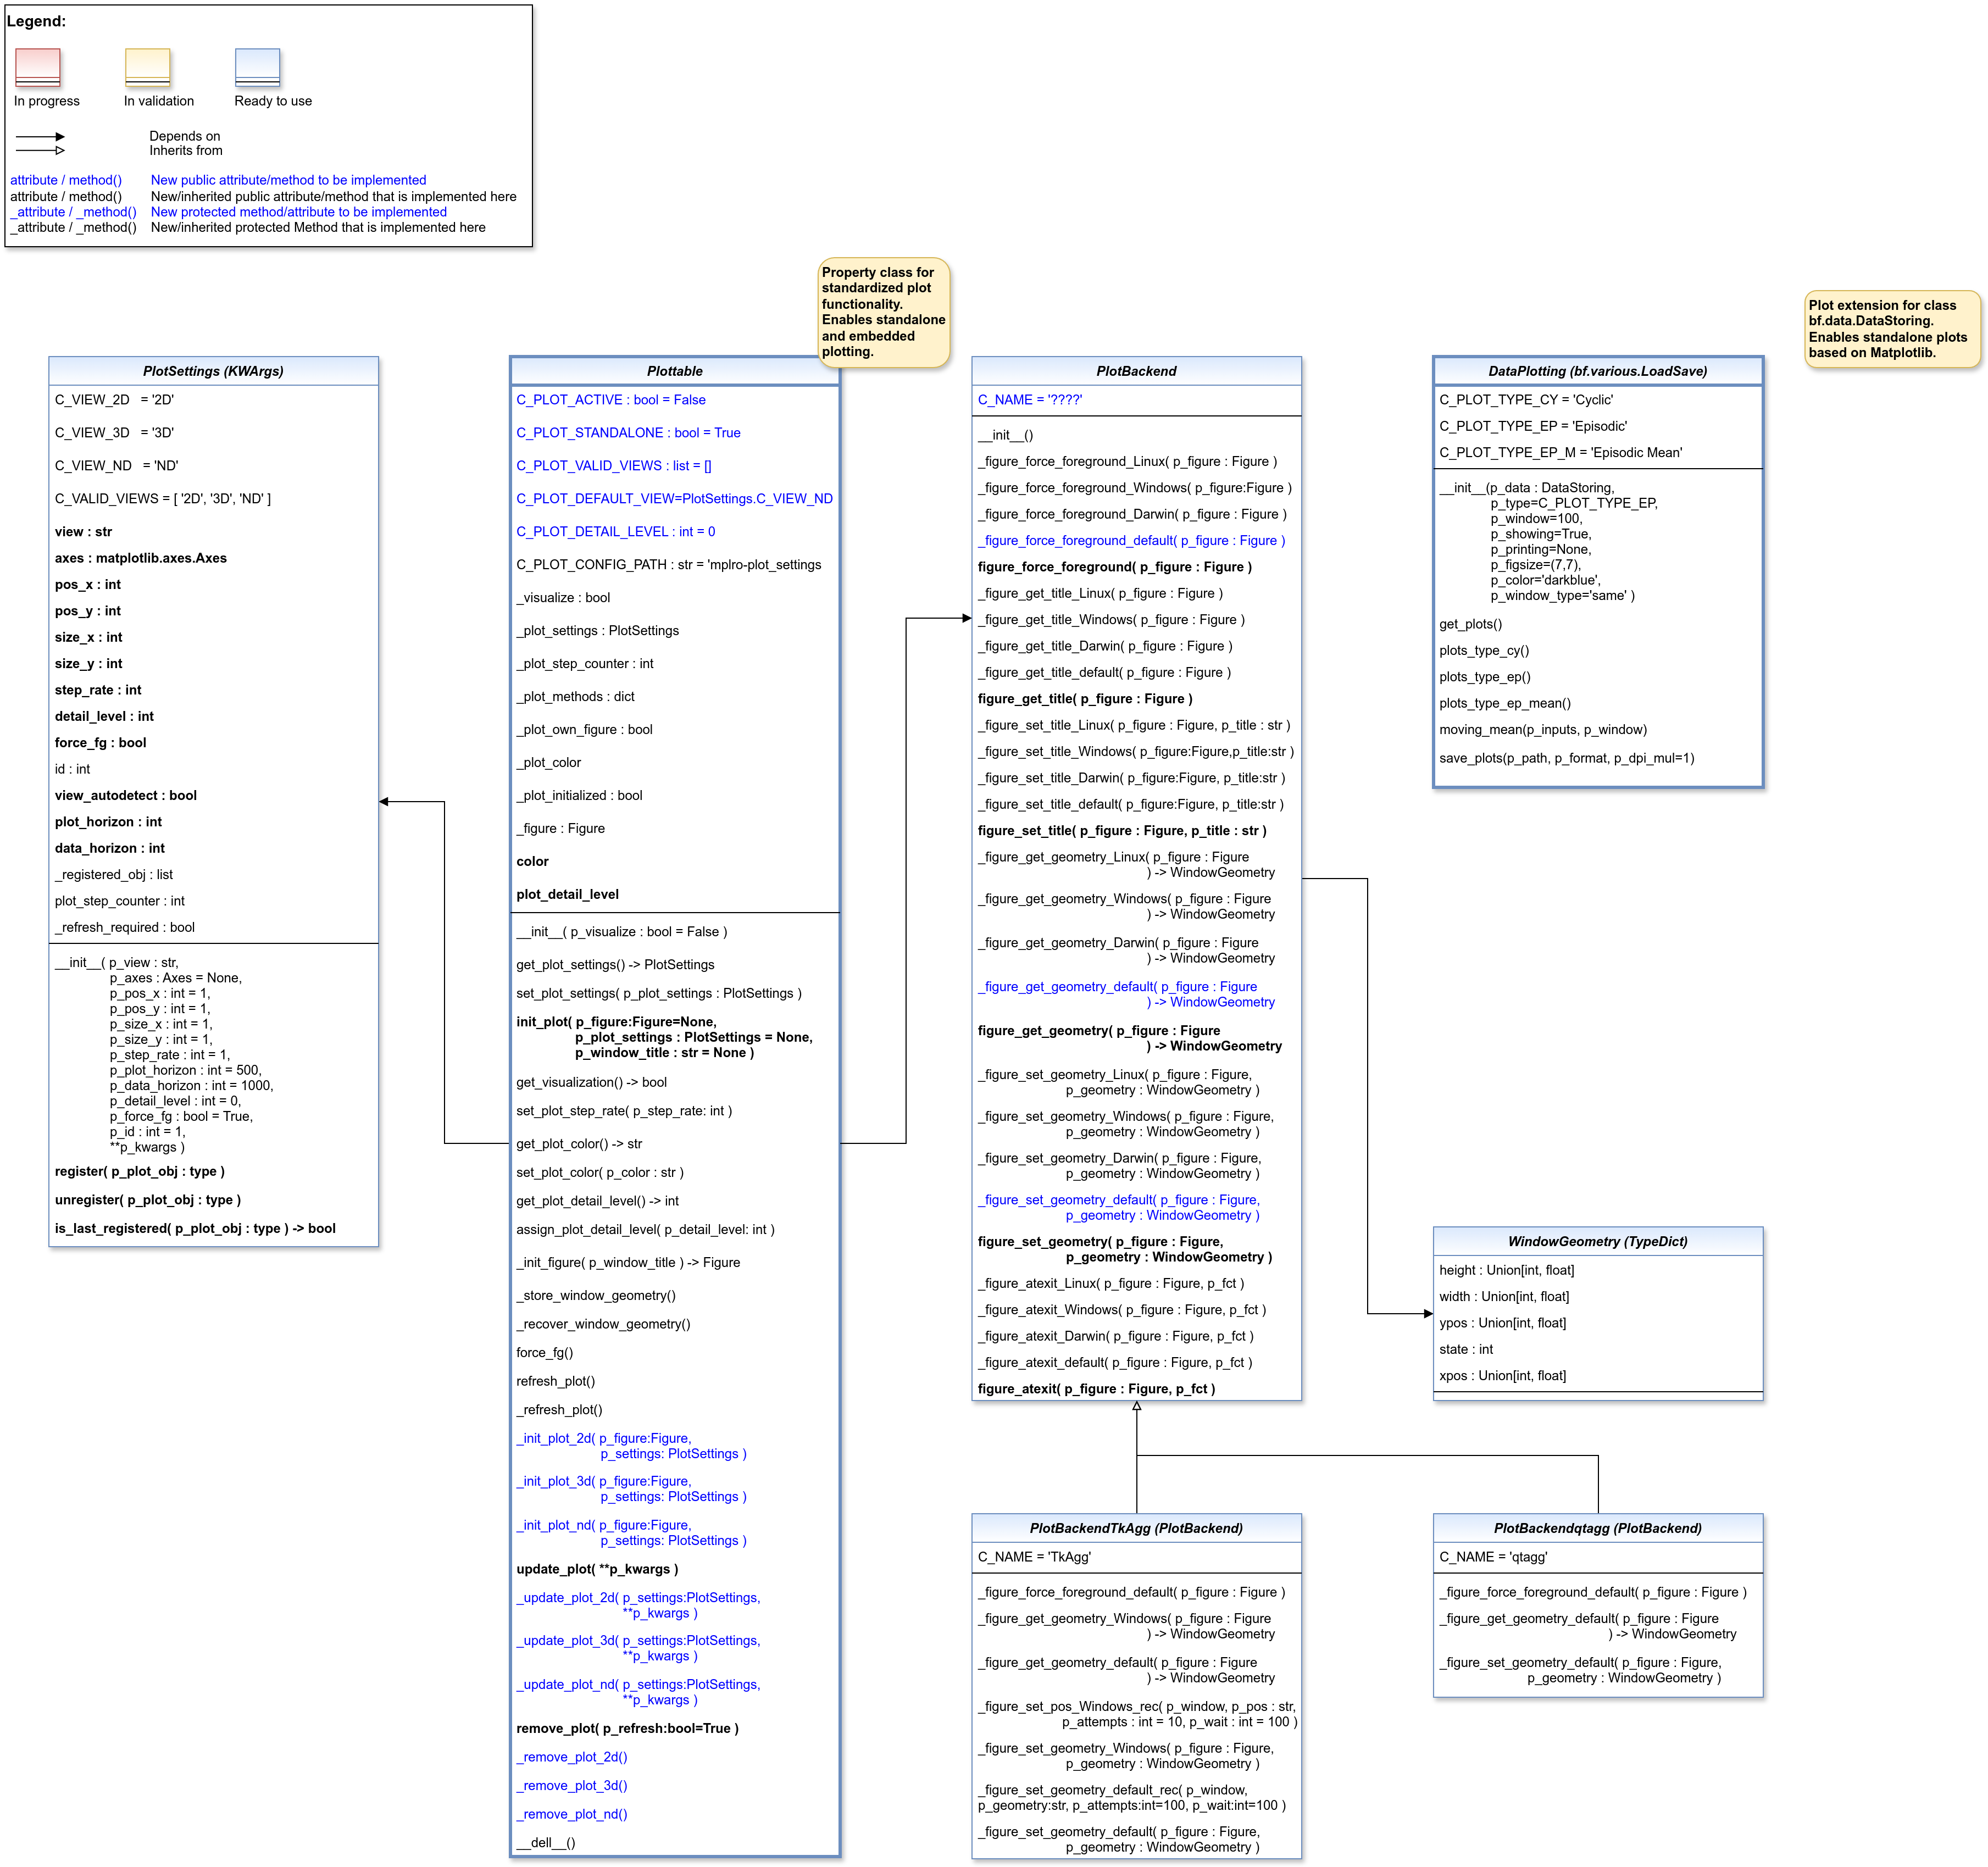
This module provides various classes related to data plotting.
- class mlpro.bf.plot.basics.Figure
Bases:
object
- class mlpro.bf.plot.basics.PlotSettings(p_view: str, p_axes: Axes = None, p_pos_x: int = 1, p_pos_y: int = 1, p_size_x: int = 1, p_size_y: int = 1, p_step_rate: int = 1, p_plot_horizon: int = 500, p_data_horizon: int = 1000, p_detail_level: int = 0, p_force_fg: bool = True, p_id: int = 1, p_view_autoselect: bool = True, **p_kwargs)
Bases:
KWArgsClass to specify the context of a subplot.
- Parameters:
p_view (str) – ID of the view (see constants C_VIEW_*)
p_axes (Axes) – Optional Matplotlib Axes object as destination for plot outputs. Default is None.
p_pos_x (int) – Optional x position of a subplot within a Matplotlib figure. Default = 1.
p_pos_y (int) – Optional y position of a subplot within a Matplotlib figure. Default = 1.
p_size_x (int) – Relative size factor in x direction. Default = 1.
p_size_y (int) – Relative size factor in y direction. Default = 1.
p_step_rate (int) – Optional step rate. Decides after how many calls of the update_plot() method the custom methods _update_plot() carries out an output. Default = 1.
p_plot_horizon (int) – Optional plot horizon for ND plot. A value > 0 limits the number of data entities shown in the plot. Default = 500.
p_data_horizon (int) – Optional data horizon for ND plot. A value > 0 limits the number of data entities buffered internally for plotting. Default = 1000.
p_detail_level (int) – Optional plot detail level. Default = 0.
p_force_fg (bool) – Optional boolean flag. If True, the releated window is kept in foreground. Default = True.
p_id (int) – Optional unique id of the subplot within the figure. Default = 1.
p_view_autoselect (bool) – If True, the final view is automatically selected during runtime. Default = True.
p_kwargs (dict) – Further optional named parameters.
- detail_level
Current plot detail level.
- Type:
int
- C_VIEW_2D = '2D'
- C_VIEW_3D = '3D'
- C_VIEW_ND = 'ND'
- C_VALID_VIEWS = ['2D', '3D', 'ND']
- register(p_plot_obj: type)
Registers the specified plotting object. Internally used in class Plottable.
- Parameters:
p_plot_obj (type) – Plotting object to be registered
- unregister(p_plot_obj: type)
Unregisters the specified plotting object. Internally used in class Plottable.
- Parameters:
p_plot_obj (type) – Plotting object to be registered
- is_last_registered(p_plot_obj: type) bool
Checks whether the specified plot object was the last one registered. Internally used in class Plottable.
- Parameters:
p_plot_obj (type) – Plotting object to be registered
- Returns:
True, if the specified plotting object was the last one registering. False otherwise.
- Return type:
bool
- copy()
Creates a copy of ifself. The values of following attributes are NOT taken over: self._registered_obj, self.plot_step_counter.
- class mlpro.bf.plot.basics.Plottable(p_visualize: bool = False)
Bases:
objectProperty class that inherits the ability to be plottable. The class is prepared for plotting with MatPlotLib but not restricted to it. Three different views are supported:
2D: 2-dimensional plot 3D: 3-dimensional plot ND: Multidimensional plot
See class Plotsettings for further detais.
- Parameters:
p_visualize (bool) – Boolean switch for visualisation. Default = False.
- C_PLOT_ACTIVE
Custom attribute to turn on or off the plot functionality. Must be turned on explicitely.
- Type:
bool
- C_PLOT_STANDALONE
Custom attribute to be set to True, if the plot needs a separate subplot or False if the plot can be added to an existing subplot.
- Type:
bool = True
- C_PLOT_VALID_VIEWS
Custom list of views that are supported/implemented (see class PlotSettings)
- Type:
list = [PlotSettings]
- C_PLOT_DEFAULT_VIEW
Custom attribute for the default view. See class PlotSettings for more details.
- Type:
str = ‘’
- C_PLOT_DETAIL_LEVEL
Custom attribute for the assigned detail level. See method assign_plot_detail_level() for more details.
- Type:
int = 0
- color
Plot color. See also: https://matplotlib.org/stable/gallery/color/named_colors.html
- Type:
str
- plot_detail_level
Own plot detail level.
- Type:
int
- C_PLOT_ACTIVE: bool = False
- C_PLOT_STANDALONE: bool = True
- C_PLOT_VALID_VIEWS: list = []
- C_PLOT_DEFAULT_VIEW: str = 'ND'
- C_PLOT_DETAIL_LEVEL: int = 0
- C_PLOT_CONFIG_PATH: str = 'mlpro-plot-settings'
- _import_plot_packages() bool
- get_plot_settings() PlotSettings
- set_plot_settings(p_plot_settings: PlotSettings)
Sets plot settings in advance (before initialization of plot).
- Parameters:
p_plot_settings (PlotSettings) – New PlotSettings to be set. If None, the default view is plotted (see attribute C_PLOT_DEFAULT_VIEW).
- init_plot(p_figure: Figure = None, p_plot_settings: PlotSettings = None, p_window_title: str = None) bool
Initializes the plot functionalities of the class.
- Parameters:
p_figure (Matplotlib.figure.Figure, optional) – Optional MatPlotLib host figure, where the plot shall be embedded. The default is None.
p_plot_settings (PlotSettings) – Optional plot settings. If None, the default view is plotted (see attribute C_PLOT_DEFAULT_VIEW).
- get_visualization() bool
- set_plot_step_rate(p_step_rate: int)
- get_plot_color()
- set_plot_color(p_color: str)
- get_plot_detail_level() int
- assign_plot_detail_level(p_detail_level: int)
Assigns an own plot detail level. Plots are carried out only, if the specified detail level is less or equal to self._plot_settings.detail_level or self._plot_settings.detail_level = 0.
- Parameters:
p_detail_level (int) – Integer detail level >=0 to be assigned.
- _init_figure(p_window_title: str = None)
Method to initialize a suitable standalone Matplotlib figure.
- _store_window_geometry()
- _recover_window_geometry()
- force_fg()
Internal use.
- refresh_plot()
Refreshes the plot.
- _refresh_plot()
Custom method to refresh the plot. Default implementation assumes standard use of Matplotlib.
- _init_plot_2d(p_figure: Figure, p_settings: PlotSettings)
Custom method to initialize a 2D plot. If attribute p_settings.axes is not None the initialization shall be done there. Otherwise a new MatPlotLib Axes object shall be created in the given figure and stored in p_settings.axes.
Note: Please call this method in your custom implementation to create a default subplot.
- Parameters:
p_figure (Matplotlib.figure.Figure) – Matplotlib figure object to host the subplot(s).
p_settings (PlotSettings) – Object with further plot settings.
- _init_plot_3d(p_figure: Figure, p_settings: PlotSettings)
Custom method to initialize a 3D plot. If attribute p_settings.axes is not None the initialization shall be done there. Otherwise a new MatPlotLib Axes object shall be created in the given figure and stored in p_settings.axes.
Note: Please call this method in your custom implementation to create a default subplot.
- Parameters:
p_figure (Matplotlib.figure.Figure) – Matplotlib figure object to host the subplot(s).
p_settings (PlotSettings) – Object with further plot settings.
- _init_plot_nd(p_figure: Figure, p_settings: PlotSettings)
Custom method to initialize a nD plot. If attribute p_settings.axes is not None the initialization shall be done there. Otherwise a new MatPlotLib Axes object shall be created in the given figure and stored in p_settings.axes.
Note: Please call this method in your custom implementation to create a default subplot.
- Parameters:
p_figure (Matplotlib.figure.Figure) – Matplotlib figure object to host the subplot(s).
p_settings (PlotSettings) – Object with further plot settings.
- update_plot(**p_kwargs)
Updates the plot.
- Parameters:
**p_kwargs – Implementation-specific plot data and/or parameters.
- _update_plot_2d(p_settings: PlotSettings, **p_kwargs) bool
Custom method to update the 2d plot. The related MatPlotLib Axes object is stored in p_settings.
- Parameters:
p_settings (PlotSettings) – Object with further plot settings.
**p_kwargs – Implementation-specific data and parameters.
- Returns:
True, if changes on the plot require a refresh of the figure. False otherwise.
- Return type:
bool
- _update_plot_3d(p_settings: PlotSettings, **p_kwargs) bool
Custom method to update the 3d plot. The related MatPlotLib Axes object is stored in p_settings.
- Parameters:
p_settings (PlotSettings) – Object with further plot settings.
**p_kwargs – Implementation-specific data and parameters.
- Returns:
True, if changes on the plot require a refresh of the figure. False otherwise.
- Return type:
bool
- _update_plot_nd(p_settings: PlotSettings, **p_kwargs) bool
Custom method to update the nd plot. The related MatPlotLib Axes object is stored in p_settings.
- Parameters:
p_settings (PlotSettings) – Object with further plot settings.
**p_kwargs – Implementation-specific data and parameters.
- Returns:
True, if changes on the plot require a refresh of the figure. False otherwise.
- Return type:
bool
- remove_plot(p_refresh: bool = True)
” Removes the plot and optionally refreshes the display.
- Parameters:
p_refresh (bool = True) – On True the display is refreshed after removal
- _remove_plot_2d()
Custom method to remove 2D plot artifacts when object is destroyed.
- _remove_plot_3d()
Custom method to remove 3D plot artifacts when object is destroyed.
- _remove_plot_nd()
Custom method to remove nd plot artifacts when object is destroyed.
- property color
- property plot_detail_level: int
Ver. 0.5.0 (2025-01-03)
This module provides the template class PlotBackend for special support of common Matplotlib backends.
- mlpro.bf.plot.backends.basics.WindowState
alias of
int
- class mlpro.bf.plot.backends.basics.WindowGeometry
Bases:
TypedDict- xpos: int | float
- ypos: int | float
- width: int | float
- height: int | float
- state: int
- class mlpro.bf.plot.backends.basics.PlotBackend
Bases:
object- C_NAME = '????'
- _figure_force_foreground_Linux(p_figure: Figure)
- _figure_force_foreground_Windows(p_figure: Figure)
- _figure_force_foreground_Darwin(p_figure: Figure)
- _figure_force_foreground_default(p_figure: Figure)
- figure_force_foreground(p_figure: Figure)
- _figure_get_title_Linux(p_figure: Figure) str
- _figure_get_title_Windows(p_figure: Figure) str
- _figure_get_title_Darwin(p_figure: Figure) str
- _figure_get_title_default(p_figure: Figure) str
- figure_get_title(p_figure: Figure) str
- _figure_set_title_Linux(p_figure: Figure, p_title: str)
- _figure_set_title_Windows(p_figure: Figure, p_title: str)
- _figure_set_title_Darwin(p_figure: Figure, p_title: str)
- _figure_set_title_default(p_figure: Figure, p_title: str)
- figure_set_title(p_figure: Figure, p_title: str)
- _figure_get_geometry_Linux(p_figure: Figure) WindowGeometry
- _figure_get_geometry_Windows(p_figure: Figure) WindowGeometry
- _figure_get_geometry_Darwin(p_figure: Figure) WindowGeometry
- _figure_get_geometry_default(p_figure: Figure) WindowGeometry
- figure_get_geometry(p_figure: Figure) WindowGeometry
- _figure_set_geometry_Linux(p_figure: Figure, p_geometry: WindowGeometry)
- _figure_set_geometry_Windows(p_figure: Figure, p_geometry: WindowGeometry)
- _figure_set_geometry_Darwin(p_figure: Figure, p_geometry: WindowGeometry)
- _figure_set_geometry_default(p_figure: Figure, p_geometry: WindowGeometry)
- figure_set_geometry(p_figure: Figure, p_geometry: WindowGeometry)
- _figure_atexit_Linux(p_figure: Figure, p_fct)
- _figure_atexit_Windows(p_figure: Figure, p_fct)
- _figure_atexit_Darwin(p_figure: Figure, p_fct)
- _figure_atexit_default(p_figure: Figure, p_fct)
- figure_atexit(p_figure: Figure, p_fct)
Ver. 0.3.0 (2025-04-05)
This module provides an integration for Matplotlib backend ‘qtagg’.
- class mlpro.bf.plot.backends.qtagg.PlotBackendqtagg
Bases:
PlotBackendIntegrates the Matplotlib backend ‘qtagg’ into MLPro.
- C_NAME = 'qtagg'
- _figure_force_foreground_default(p_figure: Figure)
- _figure_get_geometry_default(p_figure: Figure) WindowGeometry
- _figure_set_geometry_default(p_figure: Figure, p_geometry: WindowGeometry)
- class mlpro.bf.plot.backends.qtagg.PlotBackendQtAgg
Bases:
PlotBackendqtagg
Ver. 0.4.0 (2025-01-03)
This module provides an integration for Matplotlib backend ‘TkAgg’.
- class mlpro.bf.plot.backends.tkagg.PlotBackendTkAgg
Bases:
PlotBackendIntegrates the Matplotlib backend ‘TkAgg’ into MLPro.
- C_NAME = 'TkAgg'
- _figure_force_foreground_default(p_figure)
- _figure_get_geometry_Windows(p_figure) WindowGeometry
- _figure_get_geometry_default(p_figure) WindowGeometry
- _figure_set_pos_Windows_rec(p_window, p_pos: str, p_attempts: int = 10, p_wait: int = 100)
- _figure_set_geometry_Windows(p_figure: Figure, p_geometry: WindowGeometry)
- _figure_set_geometry_default_rec(p_window, p_geometry: str, p_attempts: int = 10, p_wait: int = 100)
- _figure_set_geometry_default(p_figure: Figure, p_geometry: WindowGeometry)
Ver. 3.0.0 (2024-12-10)
This module provides various classes related to data plotting.
- class mlpro.bf.plot.dataplotting.DataPlotting(p_data: DataStoring, p_type='Episodic', p_window=100, p_showing=True, p_printing=None, p_figsize=(7, 7), p_color='darkblue', p_window_type='same')
Bases:
PersistentThis class provides a functionality to plot the stored values of variables.
- Parameters:
p_data (DataStoring) – Data object with stored variables values.
p_type (str, optional) – Type of plot. The default is C_PLOT_TYPE_EP.
p_window (int, optional) – Moving average parameter. The default is 100.
p_showing (Bool, optional) – Showing graphs after they are generated. The default is True.
p_printing (dict, optional) –
Additional important parameters for plotting. [0] = Bool : Whether the stored values is plotted. [1] = Float : Min. value on graph. [2] = Float : Max. value on graph. Set to -1, if you want to set min/max value according to the stored values. Example = {“p_variable_1” : [True,0,-1],
”p_variable_2” : [True,-0.5,10]}.
The default is None.
p_figsize (int, optional) – Frame size. The default is (7,7).
p_color (str, optional) – Line colors. The default is “darkblue”.
p_window_type (str, optional) – Plotting type for moving average. The default is ‘same’. Options: ‘same’, ‘full’, ‘valid’
- C_PLOT_TYPE_CY
one of the plotting types, which plot the graph with multiple lines according to the number of frames.
- Type:
str
- C_PLOT_TYPE_EP
one of the plotting types, which plot the graph everything in one line regardless the number of frames.
- Type:
str
- C_PLOT_TYPE_EP_M
one of the plotting types, which plot only the mean value of each variable for each frame.
- Type:
str
- C_PLOT_TYPE_CY = 'Cyclic'
- C_PLOT_TYPE_EP = 'Episodic'
- C_PLOT_TYPE_EP_M = 'Episodic Mean'
- C_PLOT_TYPE_EP_S = 'Episodic Sum'
- get_plots()
A function to plot data.
- plots_type_cy()
A function to plot data per cycle.
- plots_type_ep()
A function to plot data per frame by extending the cyclic plots in one plot.
- plots_type_ep_mean()
A function to plot data per frame according to its mean value.
- plots_type_ep_sum()
A function to plot data per frame according to its sum value.
- moving_mean(p_inputs, p_window)
This method creates a series of averages of different subsets of the full data set.
- Parameters:
p_inputs (list of floats) – input dataset.
p_window (int) – moving average parameter.
- Returns:
outputs – transformed data set.
- Return type:
list of floats
- save_plots(p_path, p_format, p_dpi_mul=1)
This method is used to save generated plots.
- Parameters:
p_path (str) – Path where file will be saved.
p_format (str) – Format of the saved file. Options: ‘eps’, ‘jpg’, ‘png’, ‘pdf’, ‘svg’.
p_dpi_mul (int, optional) – Saving plots parameter. The default is 1.
- Returns:
True, if plots where saved successfully. False otherwise..
- Return type:
bool