Howto 20 - (RL) Train Multi Geometry with SB3 wrapper
Ver. 1.0.1 (2022-04-21)
This module shows how to use SB3 wrapper to train Multi Geometry Robot
Prerequisites
- Please install the following packages to run this examples properly:
RL Environment Multi Geometry Robot
Results

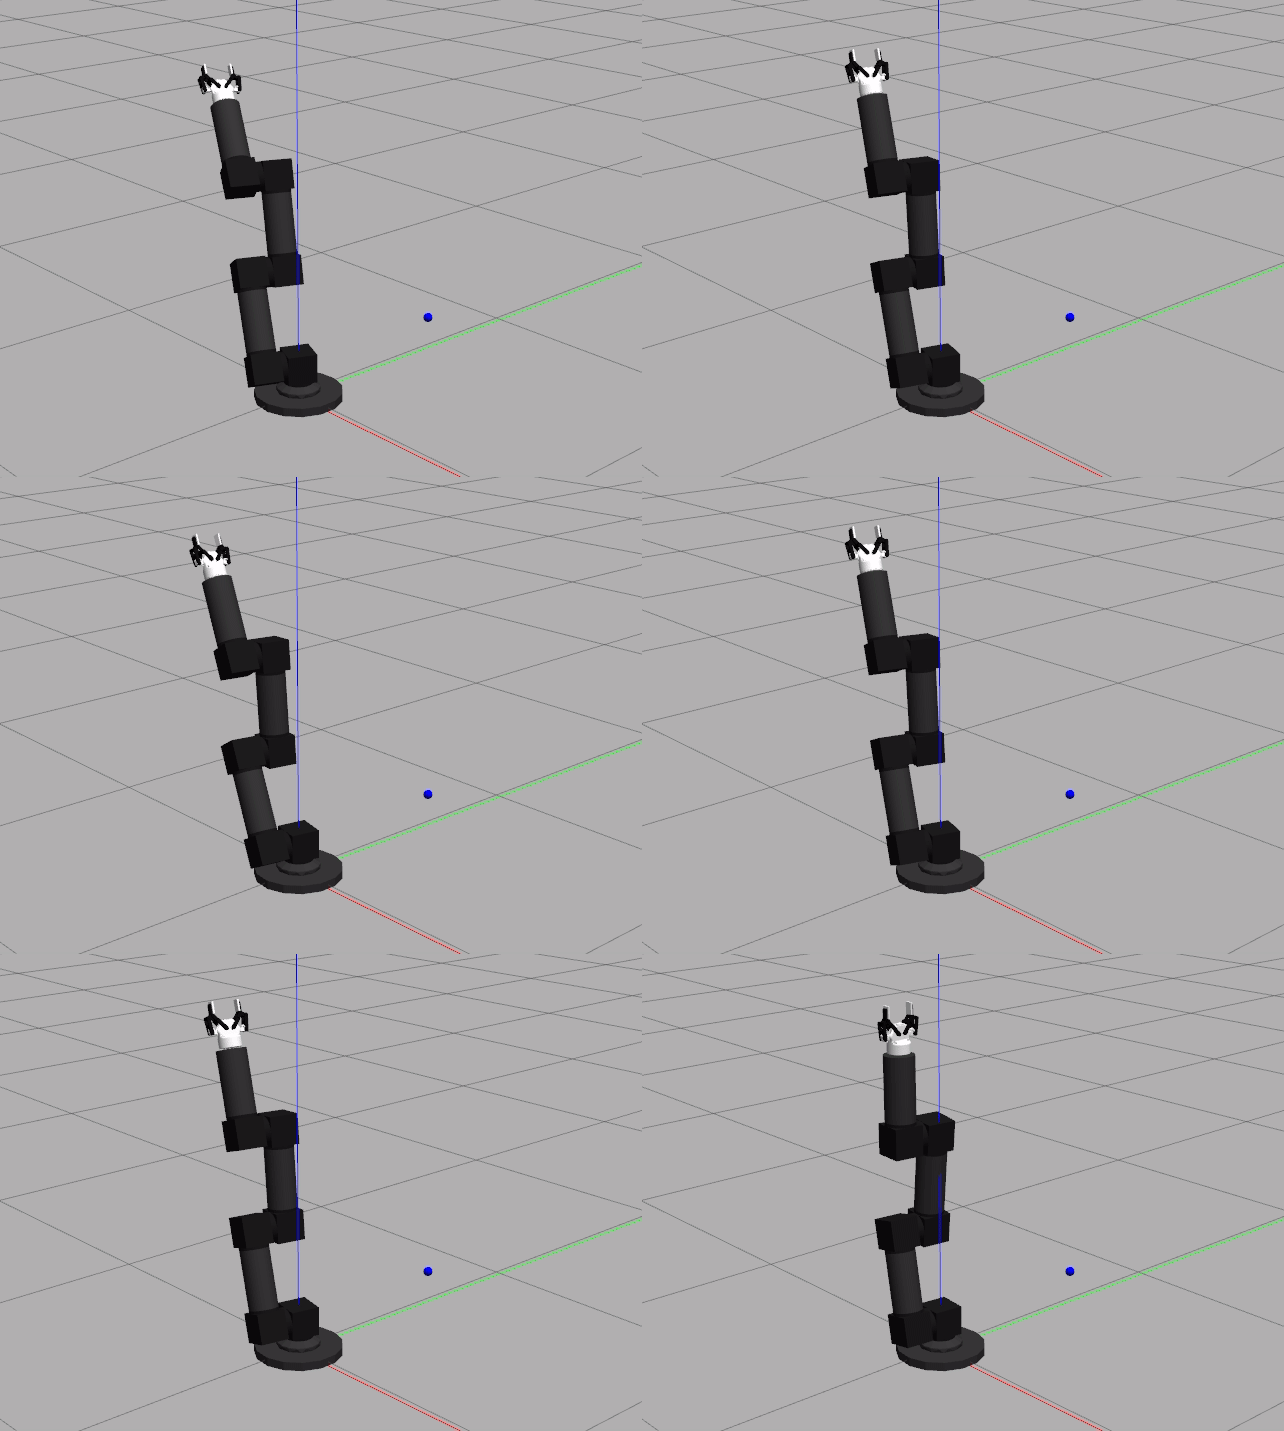
The Gazebo GUI should be the first thing that shows up. The Multi Geometry robot will move depending on the given action and the training is run. When the training is done, the logged rewards will be plotted using the matplotlib library.
The plotted figure is is not reproducible due to the simulator’s nature of simulating real world scenario. Although seeds can be set for the random generator, the sampling cannot be done at the exact same time during different runs. For a more reproducible result, the 20th example is more appropriate.
Example Code
## -------------------------------------------------------------------------------------------------
## -- Project : MLPro - A Synoptic Framework for Standardized Machine Learning Tasks
## -- Package : mlpro
## -- Module  : Howto 20 - (RL) Train Multi Geometry with SB3 wrapper
## -------------------------------------------------------------------------------------------------
## -- History :
## -- yyyy-mm-dd  Ver.      Auth.    Description
## -- 2021-12-19  0.0.0     MRD      Creation
## -- 2021-12-19  1.0.0     MRD      Initial Release
## -- 2021-12-23  1.0.1     DA       Minor fix
## -------------------------------------------------------------------------------------------------

"""
Ver. 1.0.1 (2021-12-23)

This module shows how to use SB3 wrapper to train Multi Geometry Robot.
"""

from mlpro.bf.math import *
from mlpro.rl.models import *
from mlpro.rl.pool.envs.multigeorobot import MultiGeo
from stable_baselines3 import PPO
from mlpro.wrappers.sb3 import WrPolicySB32MLPro
from pathlib import Path


# 1 Implement your own RL scenario
class ScenarioMultiGeoPPO(RLScenario):
    C_NAME = 'Matrix'

    def _setup(self, p_mode, p_ada, p_logging):
        # 1 Setup environment
        self._env = MultiGeo(p_logging=p_logging)

        policy_sb3 = PPO(
            policy="MlpPolicy",
            n_steps=20,
            env=None,
            _init_setup_model=False,
            device="cpu",
            seed=1)

        policy_wrapped = WrPolicySB32MLPro(
            p_sb3_policy=policy_sb3,
            p_cycle_limit=self._cycle_limit,
            p_observation_space=self._env.get_state_space(),
            p_action_space=self._env.get_action_space(),
            p_ada=p_ada,
            p_logging=p_logging)

        # 2 Setup standard single-agent with own policy
        return Agent(
            p_policy=policy_wrapped,
            p_envmodel=None,
            p_name='Smith',
            p_ada=p_ada,
            p_logging=p_logging
        )


# 3 Train agent in scenario
now = datetime.now()

training = RLTraining(
    p_scenario_cls=ScenarioMultiGeoPPO,
    p_cycle_limit=1000,
    p_cycles_per_epi_limit=-1,
    p_collect_states=True,
    p_collect_actions=True,
    p_collect_rewards=True,
    p_collect_training=True,
    p_visualize=False,
    p_path=str(Path.home()),
    p_logging=Log.C_LOG_ALL)

training.run()


# 4 Create Plotting Class
class MyDataPlotting(DataPlotting):
    def get_plots(self):
        """
        A function to plot data
        """
        for name in self.data.names:
            maxval = 0
            minval = 0
            if self.printing[name][0]:
                fig = plt.figure(figsize=(7, 7))
                raw = []
                label = []
                ax = fig.subplots(1, 1)
                ax.set_title(name)
                ax.grid(True, which="both", axis="both")
                for fr_id in self.data.frame_id[name]:
                    raw.append(np.sum(self.data.get_values(name, fr_id)))
                    if self.printing[name][1] == -1:
                        maxval = max(raw)
                        minval = min(raw)
                    else:
                        maxval = self.printing[name][2]
                        minval = self.printing[name][1]

                    label.append("%s" % fr_id)
                ax.plot(raw)
                ax.set_ylim(minval - (abs(minval) * 0.1), maxval + (abs(maxval) * 0.1))
                ax.set_xlabel("Episode")
                ax.legend(label, bbox_to_anchor=(1, 0.5), loc="center left")
                self.plots[0].append(name)
                self.plots[1].append(ax)
                if self.showing:
                    plt.show()
                else:
                    plt.close(fig)


# 5 Plotting 1 MLpro
data_printing = {"Cycle": [False],
                 "Day": [False],
                 "Second": [False],
                 "Microsecond": [False],
                 "Smith": [True, -1]}

mem = training.get_results().ds_rewards
mem_plot = MyDataPlotting(mem, p_showing=True, p_printing=data_printing)
mem_plot.get_plots()