BF-MATH-GEOMETRY - Geometric figures
Ver. 1.0.0 (2024-06-03)
This module provides basic definitions for geometric shapes.
Ver. 2.0.0 (2025-06-08)
This module provides a property class for the geometric shape ‘point’.
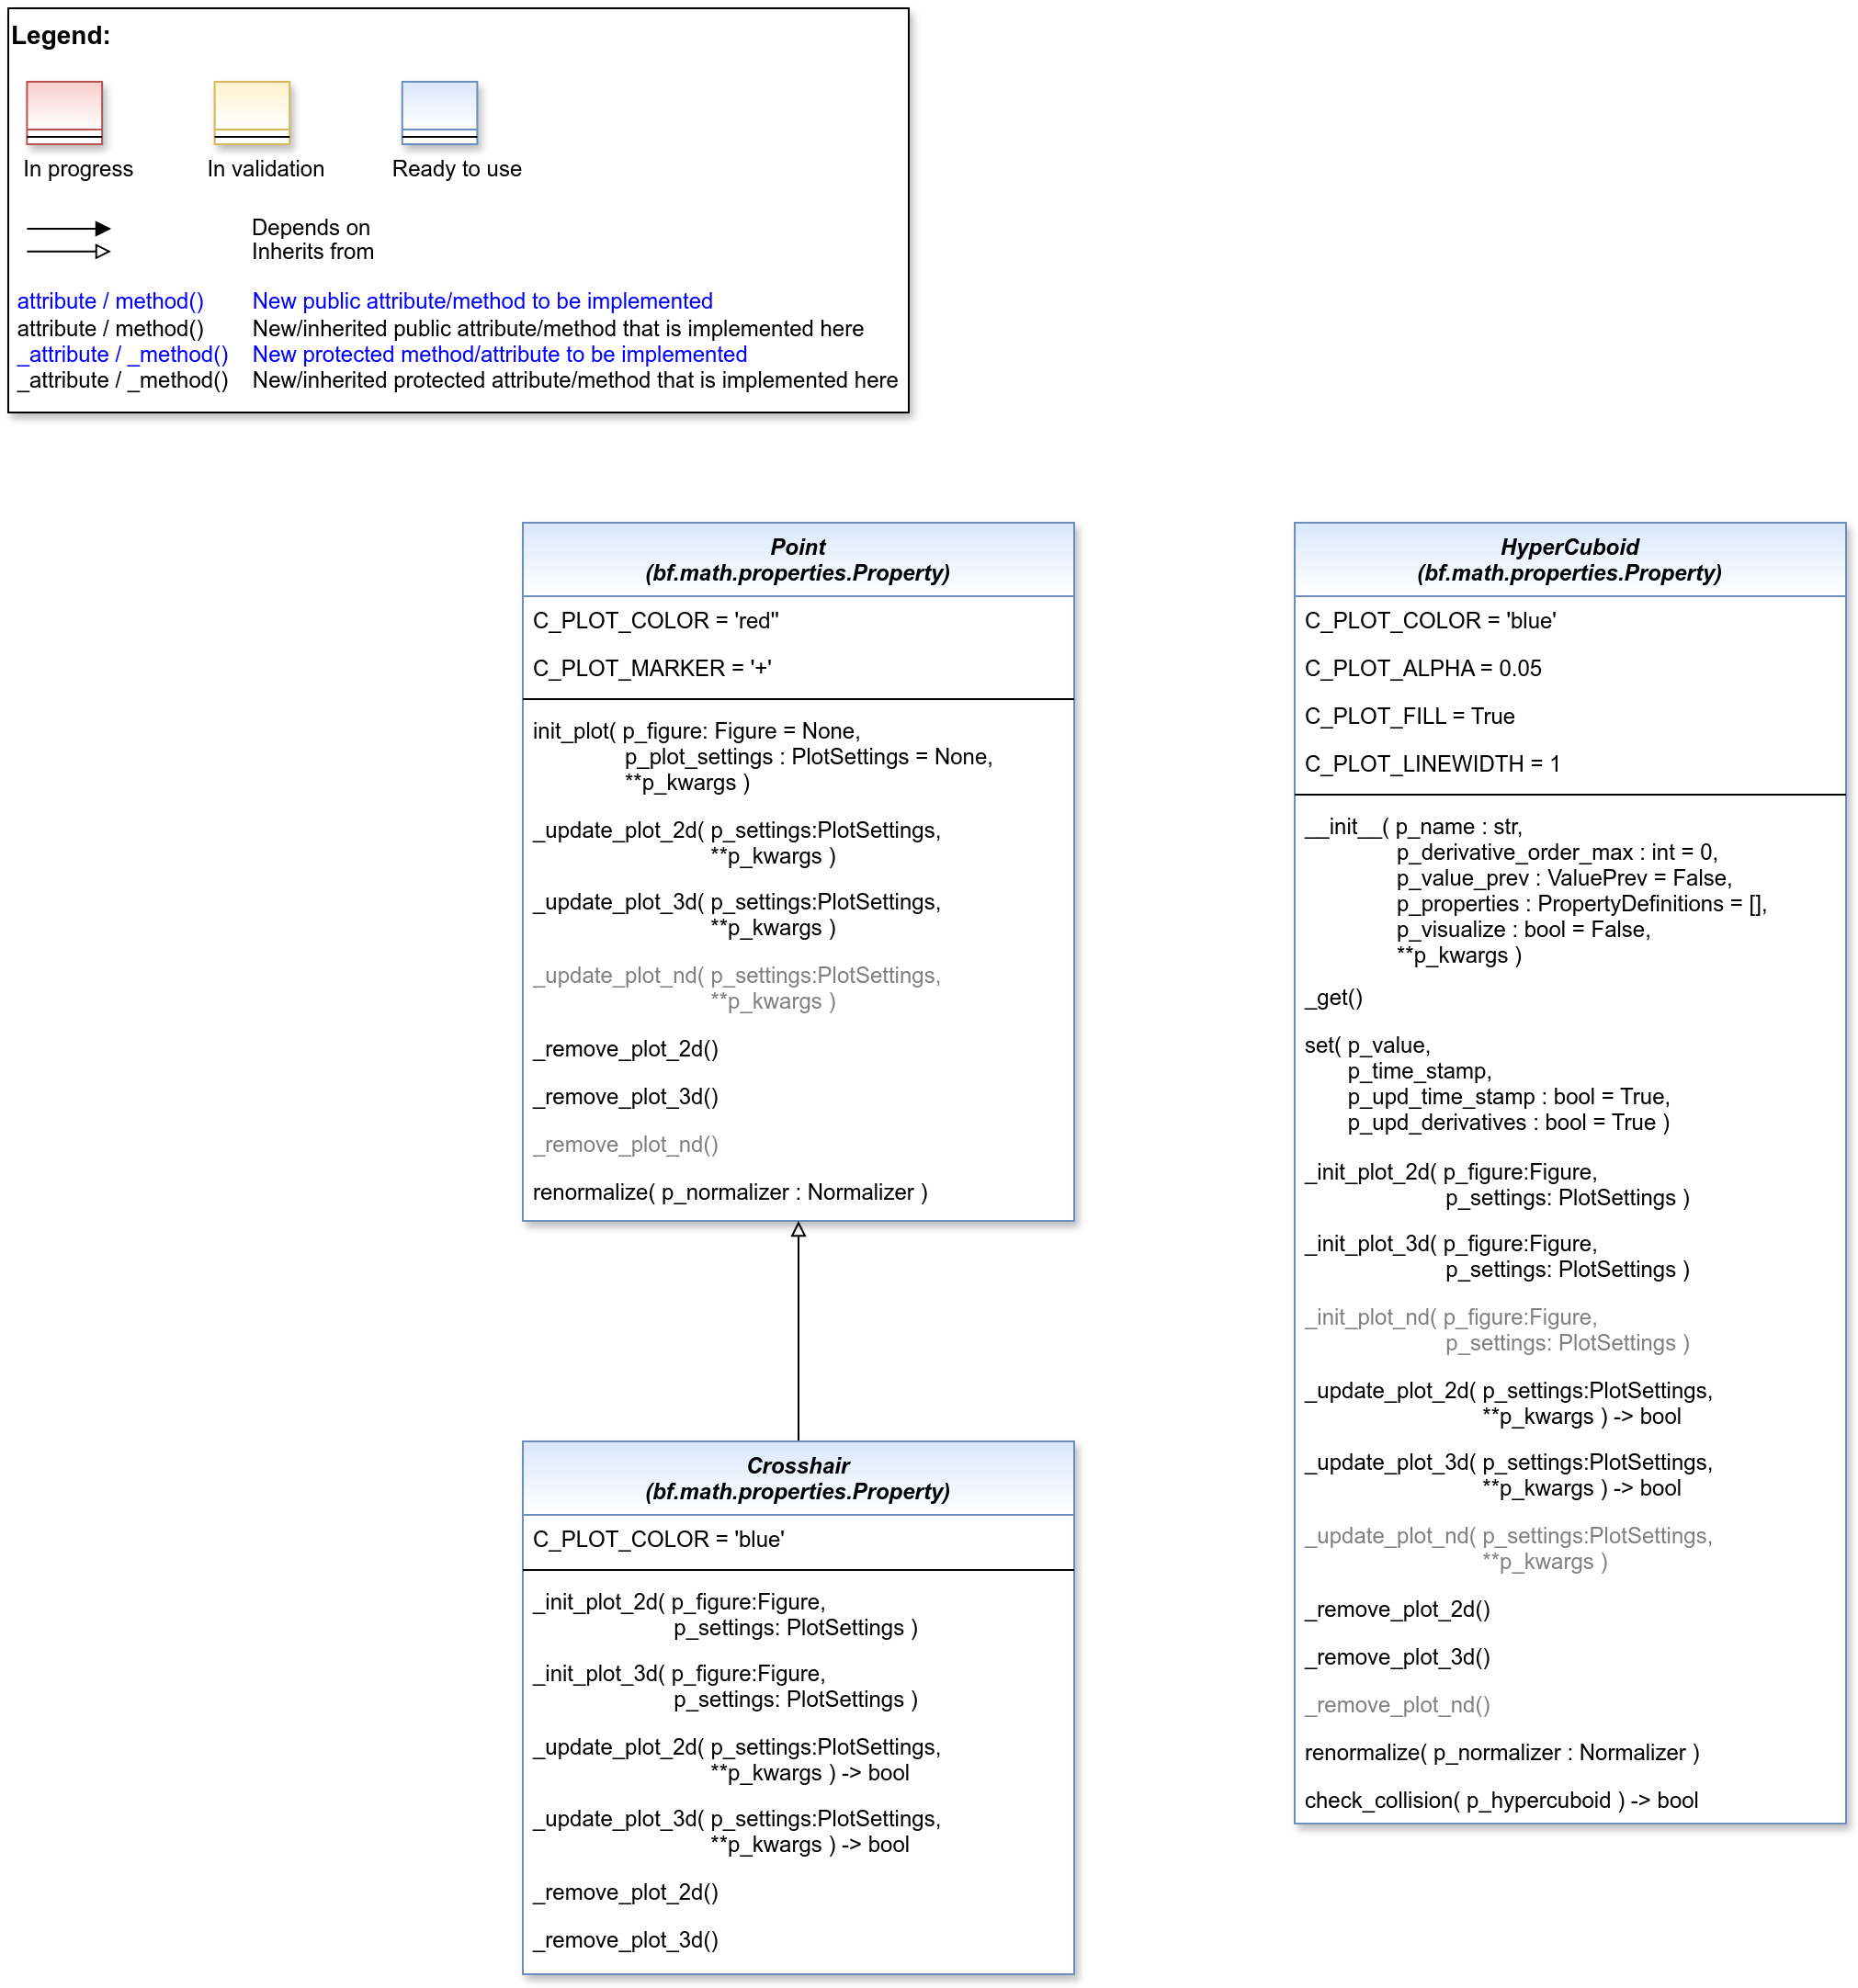
- class mlpro.bf.math.geometry.point.Point(p_name: str, p_derivative_order_max: int = 0, p_value_prev: bool = False, p_visualize: bool = False, **p_kwargs)
Bases:
PropertyImplementation of a point in a hyper space. Current position, velocity and acceleration are managed.
- value
Current point coordinates
- color
Plot color.
- Type:
str
- marker
Plot marker.
- Type:
str
- C_PLOT_ACTIVE: bool = True
- C_PLOT_STANDALONE: bool = False
- C_PLOT_VALID_VIEWS: list = ['2D', '3D', 'ND']
- C_PLOT_DEFAULT_VIEW: str = 'ND'
- C_PLOT_COLOR = 'red'
- C_PLOT_MARKER = '+'
- init_plot(p_figure: Figure = None, p_plot_settings: PlotSettings = None, **p_kwargs)
Initializes the plot functionalities of the class.
- Parameters:
p_figure (Matplotlib.figure.Figure, optional) – Optional MatPlotLib host figure, where the plot shall be embedded. The default is None.
p_plot_settings (PlotSettings) – Optional plot settings. If None, the default view is plotted (see attribute C_PLOT_DEFAULT_VIEW).
- _update_plot_2d(p_settings: PlotSettings, **p_kwargs) bool
Custom method to update the 2d plot. The related MatPlotLib Axes object is stored in p_settings.
- Parameters:
p_settings (PlotSettings) – Object with further plot settings.
**p_kwargs – Implementation-specific data and parameters.
- Returns:
True, if changes on the plot require a refresh of the figure. False otherwise.
- Return type:
bool
- _update_plot_3d(p_settings: PlotSettings, **p_kwargs) bool
Custom method to update the 3d plot. The related MatPlotLib Axes object is stored in p_settings.
- Parameters:
p_settings (PlotSettings) – Object with further plot settings.
**p_kwargs – Implementation-specific data and parameters.
- Returns:
True, if changes on the plot require a refresh of the figure. False otherwise.
- Return type:
bool
- _remove_plot_2d()
Custom method to remove 2D plot artifacts when object is destroyed.
- _remove_plot_3d()
Custom method to remove 3D plot artifacts when object is destroyed.
- renormalize(p_normalizer: Normalizer)
Custom method to renormalize internally stored data.
- Parameters:
p_normalizer (Normalizier) – Suitable normalizer object to be used for renormalization.
Ver. 1.2.1 (2025-06-26)
This module provides the class Crosshair that provides crosshair functionality.
- class mlpro.bf.math.geometry.crosshair.Crosshair(p_name: str, p_derivative_order_max: int = 0, p_value_prev: bool = False, p_visualize: bool = False, **p_kwargs)
Bases:
PointThis managed property provides a crosshair functionality including - managing its position - optionally its velocity and acceleration as auto-derivatives - plot functionality - renormalization
- Parameters:
p_name (str) – Name of the property
p_derivative_order_max (DerivativeOrderMax) – Maximum order of auto-generated derivatives (numeric properties only).
p_value_prev (bool) – If True, the previous value is stored in value_prev whenever value is updated.
p_visualize (bool) – Boolean switch for visualisation. Default = False.
p_kwargs (dict) – Keyword parameters.
- C_PLOT_COLOR = 'blue'
- _init_plot_2d(p_figure: Figure, p_settings: PlotSettings)
Custom method to initialize a 2D plot. If attribute p_settings.axes is not None the initialization shall be done there. Otherwise a new MatPlotLib Axes object shall be created in the given figure and stored in p_settings.axes.
Note: Please call this method in your custom implementation to create a default subplot.
- Parameters:
p_figure (Matplotlib.figure.Figure) – Matplotlib figure object to host the subplot(s).
p_settings (PlotSettings) – Object with further plot settings.
- _init_plot_3d(p_figure: Figure, p_settings: PlotSettings)
Custom method to initialize a 3D plot. If attribute p_settings.axes is not None the initialization shall be done there. Otherwise a new MatPlotLib Axes object shall be created in the given figure and stored in p_settings.axes.
Note: Please call this method in your custom implementation to create a default subplot.
- Parameters:
p_figure (Matplotlib.figure.Figure) – Matplotlib figure object to host the subplot(s).
p_settings (PlotSettings) – Object with further plot settings.
- _init_plot_nd(p_figure, p_settings)
Custom method to initialize a nD plot. If attribute p_settings.axes is not None the initialization shall be done there. Otherwise a new MatPlotLib Axes object shall be created in the given figure and stored in p_settings.axes.
Note: Please call this method in your custom implementation to create a default subplot.
- Parameters:
p_figure (Matplotlib.figure.Figure) – Matplotlib figure object to host the subplot(s).
p_settings (PlotSettings) – Object with further plot settings.
- _update_plot_2d(p_settings: PlotSettings, **p_kwargs) bool
Custom method to update the 2d plot. The related MatPlotLib Axes object is stored in p_settings.
- Parameters:
p_settings (PlotSettings) – Object with further plot settings.
**p_kwargs – Implementation-specific data and parameters.
- Returns:
True, if changes on the plot require a refresh of the figure. False otherwise.
- Return type:
bool
- _update_plot_3d(p_settings: PlotSettings, **p_kwargs) bool
Custom method to update the 3d plot. The related MatPlotLib Axes object is stored in p_settings.
- Parameters:
p_settings (PlotSettings) – Object with further plot settings.
**p_kwargs – Implementation-specific data and parameters.
- Returns:
True, if changes on the plot require a refresh of the figure. False otherwise.
- Return type:
bool
- _update_plot_nd(p_settings: PlotSettings, **p_kwargs) bool
Custom method to update the nd plot. The related MatPlotLib Axes object is stored in p_settings.
- Parameters:
p_settings (PlotSettings) – Object with further plot settings.
**p_kwargs – Implementation-specific data and parameters.
- Returns:
True, if changes on the plot require a refresh of the figure. False otherwise.
- Return type:
bool
- _remove_plot_2d()
Custom method to remove 2D plot artifacts when object is destroyed.
- _remove_plot_3d()
Custom method to remove 3D plot artifacts when object is destroyed.
- _remove_plot_nd()
Custom method to remove nd plot artifacts when object is destroyed.
Ver. 1.4.1 (2024-12-11)
This module provides a property class for the geometric shape ‘hypercuboid’.
- class mlpro.bf.math.geometry.hypercuboid.Hypercuboid(p_name: str, p_derivative_order_max: int = 0, p_value_prev: bool = False, p_properties: List[Tuple[str, int, bool, type]] = [], p_visualize: bool = False, **p_kwargs)
Bases:
MultiPropertyImplementation of a point in a hyper space. Current position, velocity and acceleration are managed.
- values
Current boundaries of the hypercuboid as two-dimensional array-like data object. For a n-dimensional hypercuboid value[d][0] determines the lower boundary in dimension d while value[d][1] specifies the upper boundary.
- color
Plot color.
- Type:
str
- alpha
Alpha value of the plot to control the transparency of the cuboid.
- Type:
float
- fill
If True, the cuboid is plotted with a filled surface.
- Type:
bool
- linewidth
Width of the border lines of the cuboid.
- Type:
float
- C_PROPERTIES: PropertyDefinitions = [('center_geo', 0, False, <class 'mlpro.bf.math.geometry.point.Point'>), ('size_geo', 0, False, <class 'mlpro.bf.math.properties.Property'>)]
- C_PLOT_ACTIVE: bool = True
- C_PLOT_STANDALONE: bool = False
- C_PLOT_VALID_VIEWS: list = ['2D', '3D', 'ND']
- C_PLOT_DEFAULT_VIEW: str = 'ND'
- C_PLOT_COLOR = 'blue'
- C_PLOT_ALPHA = 0.05
- C_PLOT_FILL = True
- C_PLOT_LINEWIDTH = 1
- _get()
- set(p_value, p_time_stamp: datetime | int | float = None, p_upd_time_stamp: bool = True, p_upd_derivatives: bool = True)
Sets the value of a property at a given time point.
Parameters:
- p_value
Value of the property of any type (numeric, vectorial, textual, list, dict, …). In case of auto-derivation only lists, numpy arrays and scalar numbers are supported. Lists are converted to numpy arrays.
- p_time_stamp: Union[datetime, int, float]
Optional time stamp of type datetime, int or float. If not provided, an internal continuous integer time stamp is generated.
- p_upd_time_stampbool
Boolean switch to enable/disable updating the inner time stamps.
- p_upd_derivativesbool
Boolean swtich to enable/disable updating the derivatives.
- _init_plot_2d(p_figure: Figure, p_settings: PlotSettings)
Custom method to initialize a 2D plot. If attribute p_settings.axes is not None the initialization shall be done there. Otherwise a new MatPlotLib Axes object shall be created in the given figure and stored in p_settings.axes.
Note: Please call this method in your custom implementation to create a default subplot.
- Parameters:
p_figure (Matplotlib.figure.Figure) – Matplotlib figure object to host the subplot(s).
p_settings (PlotSettings) – Object with further plot settings.
- _init_plot_3d(p_figure: Figure, p_settings: PlotSettings)
Custom method to initialize a 3D plot. If attribute p_settings.axes is not None the initialization shall be done there. Otherwise a new MatPlotLib Axes object shall be created in the given figure and stored in p_settings.axes.
Note: Please call this method in your custom implementation to create a default subplot.
- Parameters:
p_figure (Matplotlib.figure.Figure) – Matplotlib figure object to host the subplot(s).
p_settings (PlotSettings) – Object with further plot settings.
- _init_plot_nd(p_figure: Figure, p_settings: PlotSettings)
Custom method to initialize a nD plot. If attribute p_settings.axes is not None the initialization shall be done there. Otherwise a new MatPlotLib Axes object shall be created in the given figure and stored in p_settings.axes.
Note: Please call this method in your custom implementation to create a default subplot.
- Parameters:
p_figure (Matplotlib.figure.Figure) – Matplotlib figure object to host the subplot(s).
p_settings (PlotSettings) – Object with further plot settings.
- _update_plot_2d(p_settings: PlotSettings, **p_kwargs) bool
Custom method to update the 2d plot. The related MatPlotLib Axes object is stored in p_settings.
- Parameters:
p_settings (PlotSettings) – Object with further plot settings.
**p_kwargs – Implementation-specific data and parameters.
- Returns:
True, if changes on the plot require a refresh of the figure. False otherwise.
- Return type:
bool
- _update_plot_3d(p_settings: PlotSettings, **p_kwargs) bool
Custom method to update the 3d plot. The related MatPlotLib Axes object is stored in p_settings.
- Parameters:
p_settings (PlotSettings) – Object with further plot settings.
**p_kwargs – Implementation-specific data and parameters.
- Returns:
True, if changes on the plot require a refresh of the figure. False otherwise.
- Return type:
bool
- _remove_plot_2d()
Custom method to remove 2D plot artifacts when object is destroyed.
- _remove_plot_3d()
Custom method to remove 3D plot artifacts when object is destroyed.
- renormalize(p_normalizer: Normalizer)
Custom method to renormalize internally stored data.
- Parameters:
p_normalizer (Normalizier) – Suitable normalizer object to be used for renormalization.
- check_collision(p_hypercuboid) bool
- property value